
← All short courses
LLM Temperature, Visually
A nine-part, hand-drawn walkthrough of how temperature shapes an LLM's next-token sampling — from logits and softmax to practical settings and the mistakes to avoid.
9 slides · read top to bottom
- 01 / 9
What Is Temperature
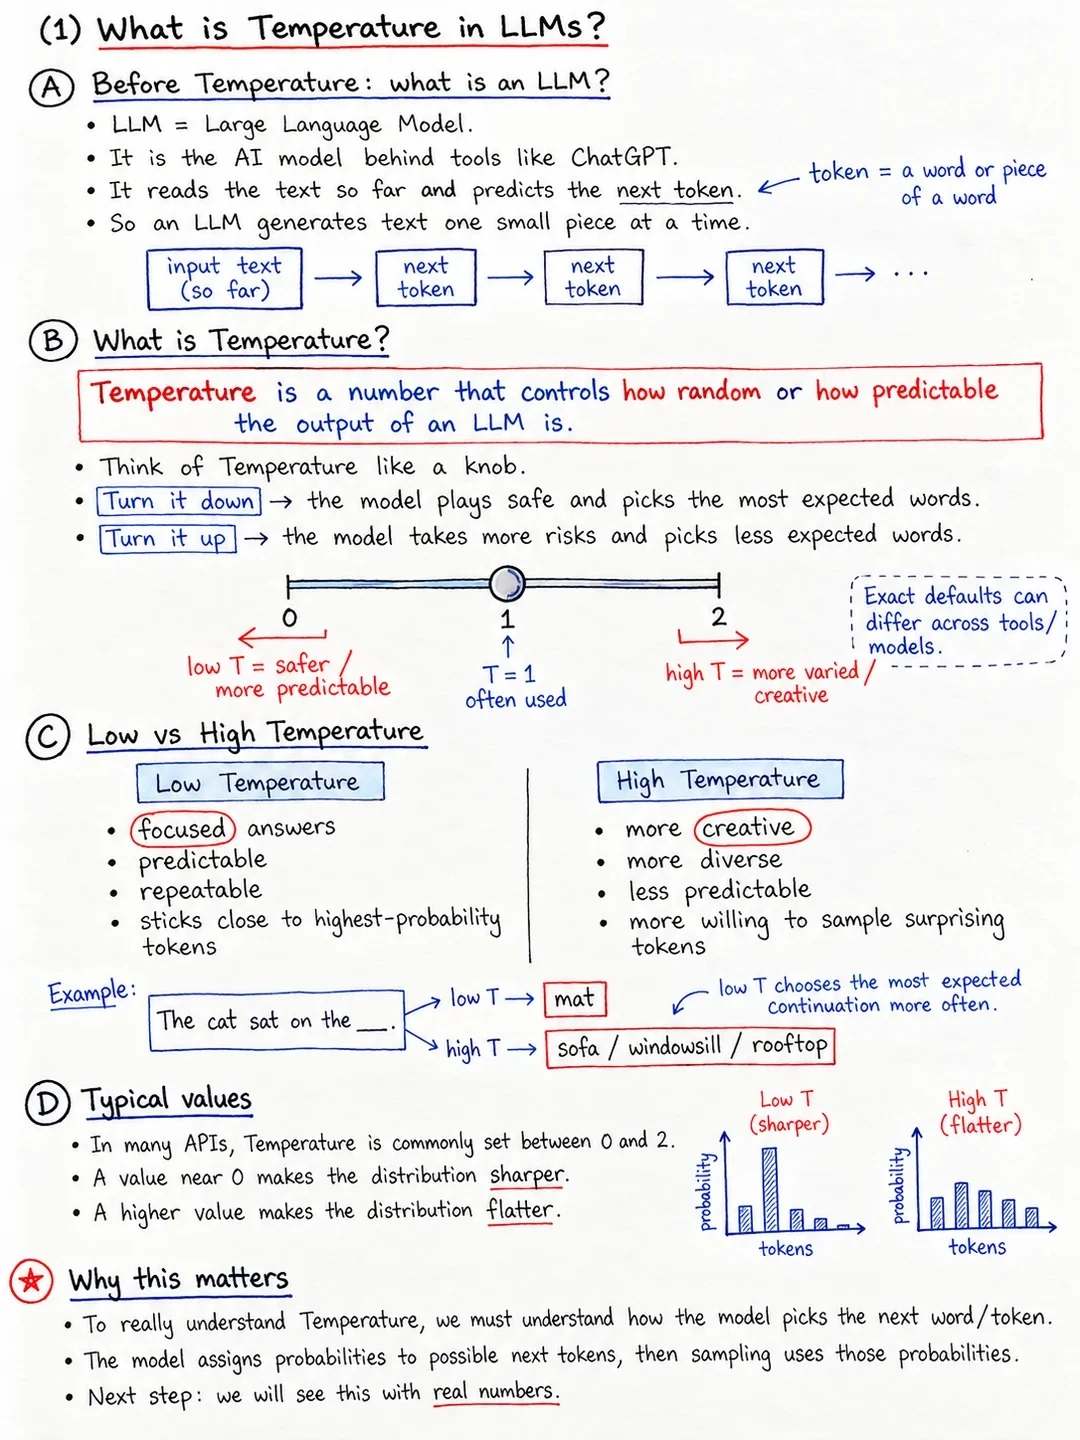
- 02 / 9
How LLM Pick Next Token
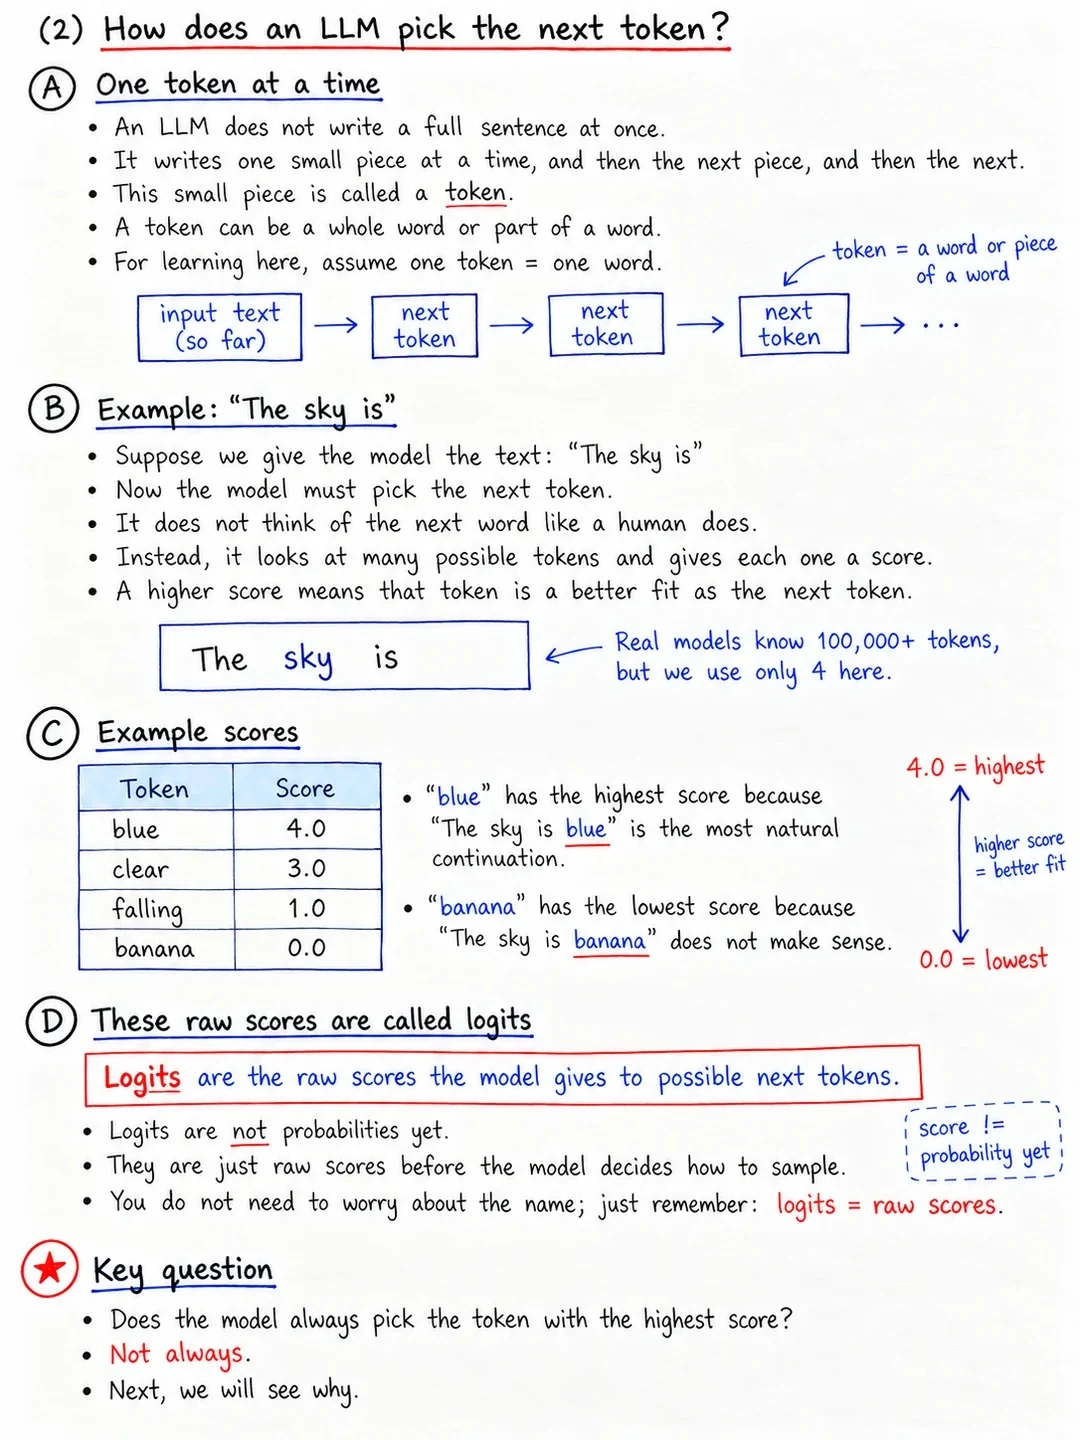
- 03 / 9
From Score to Probabilities
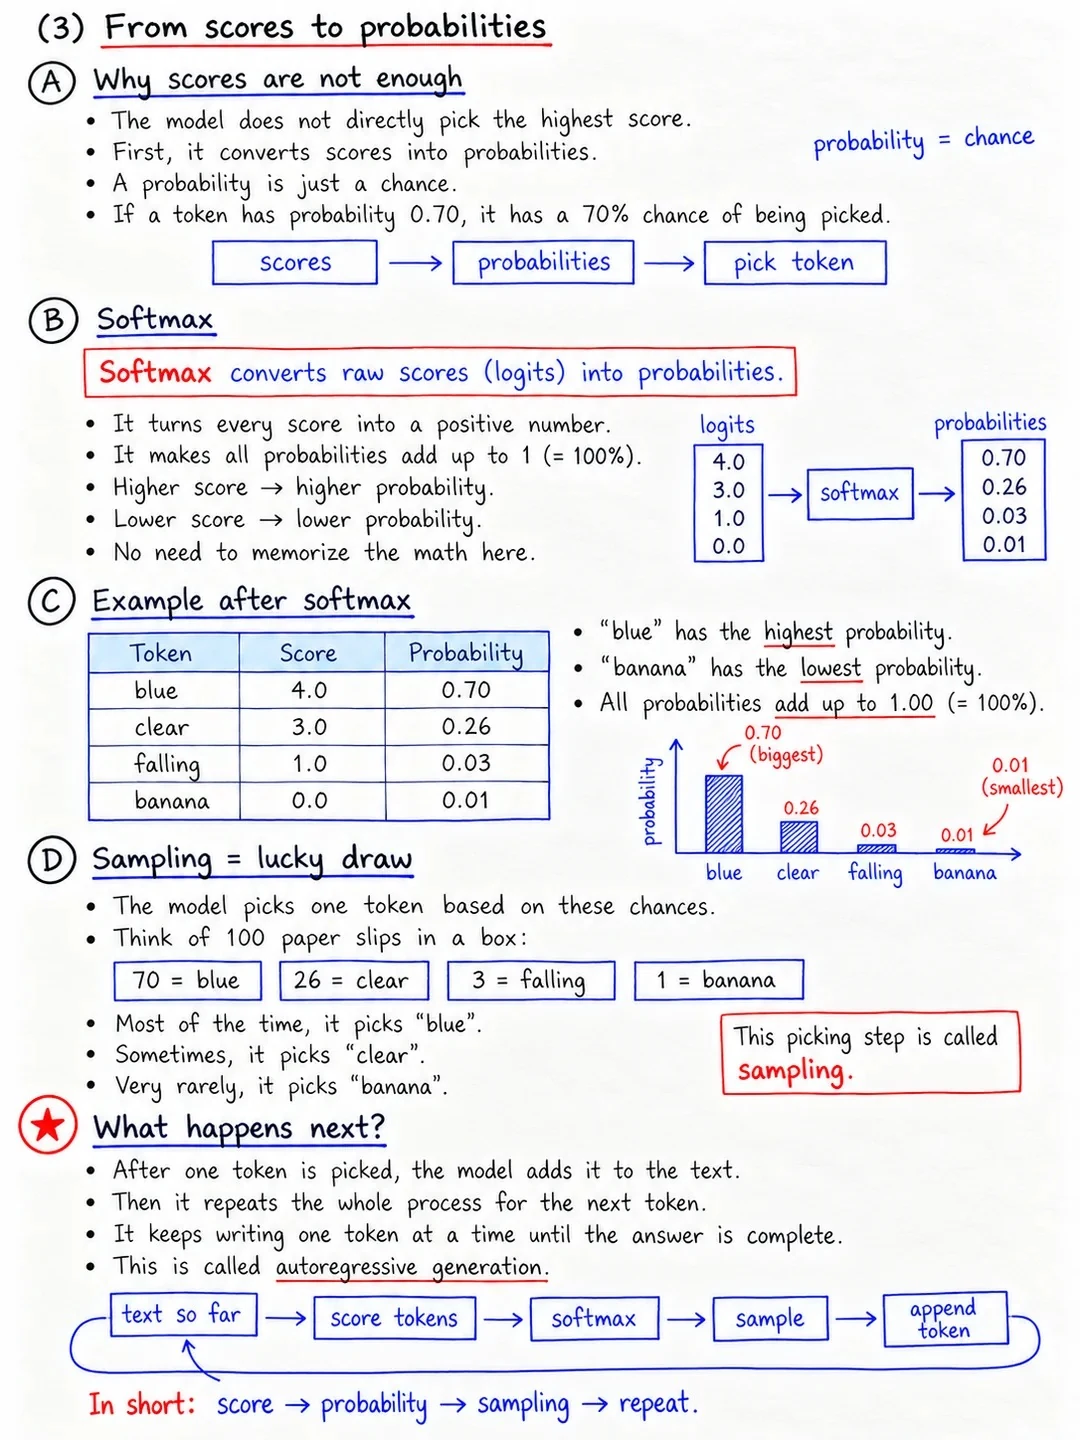
- 04 / 9
Where Temperature Comes to Picture
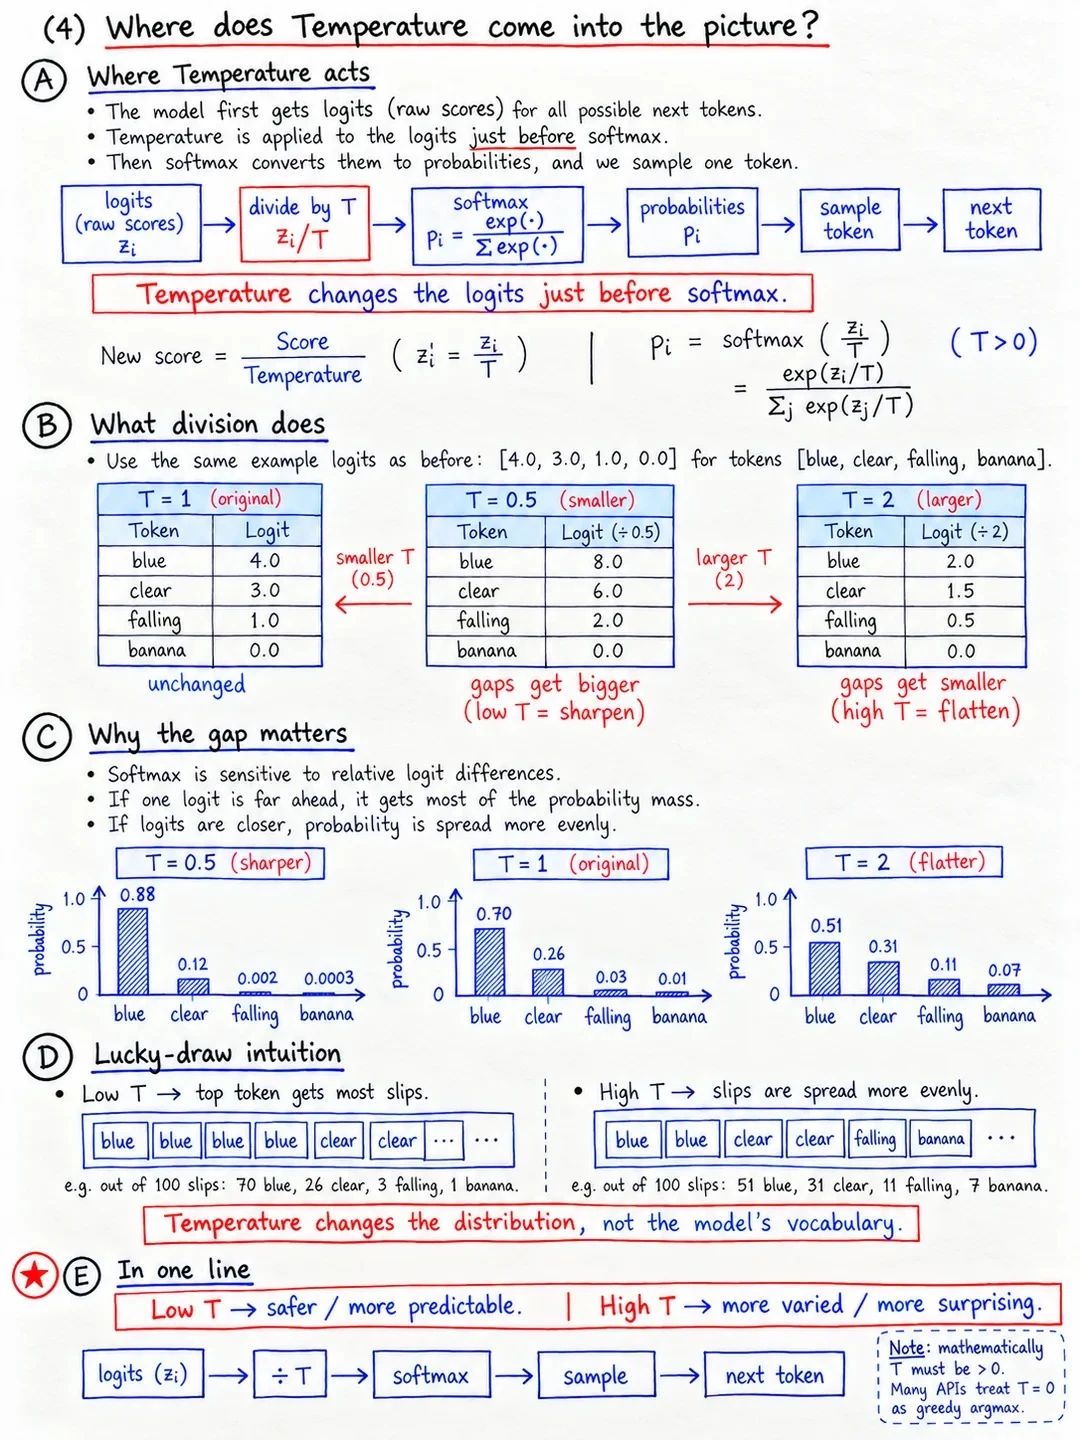
- 05 / 9
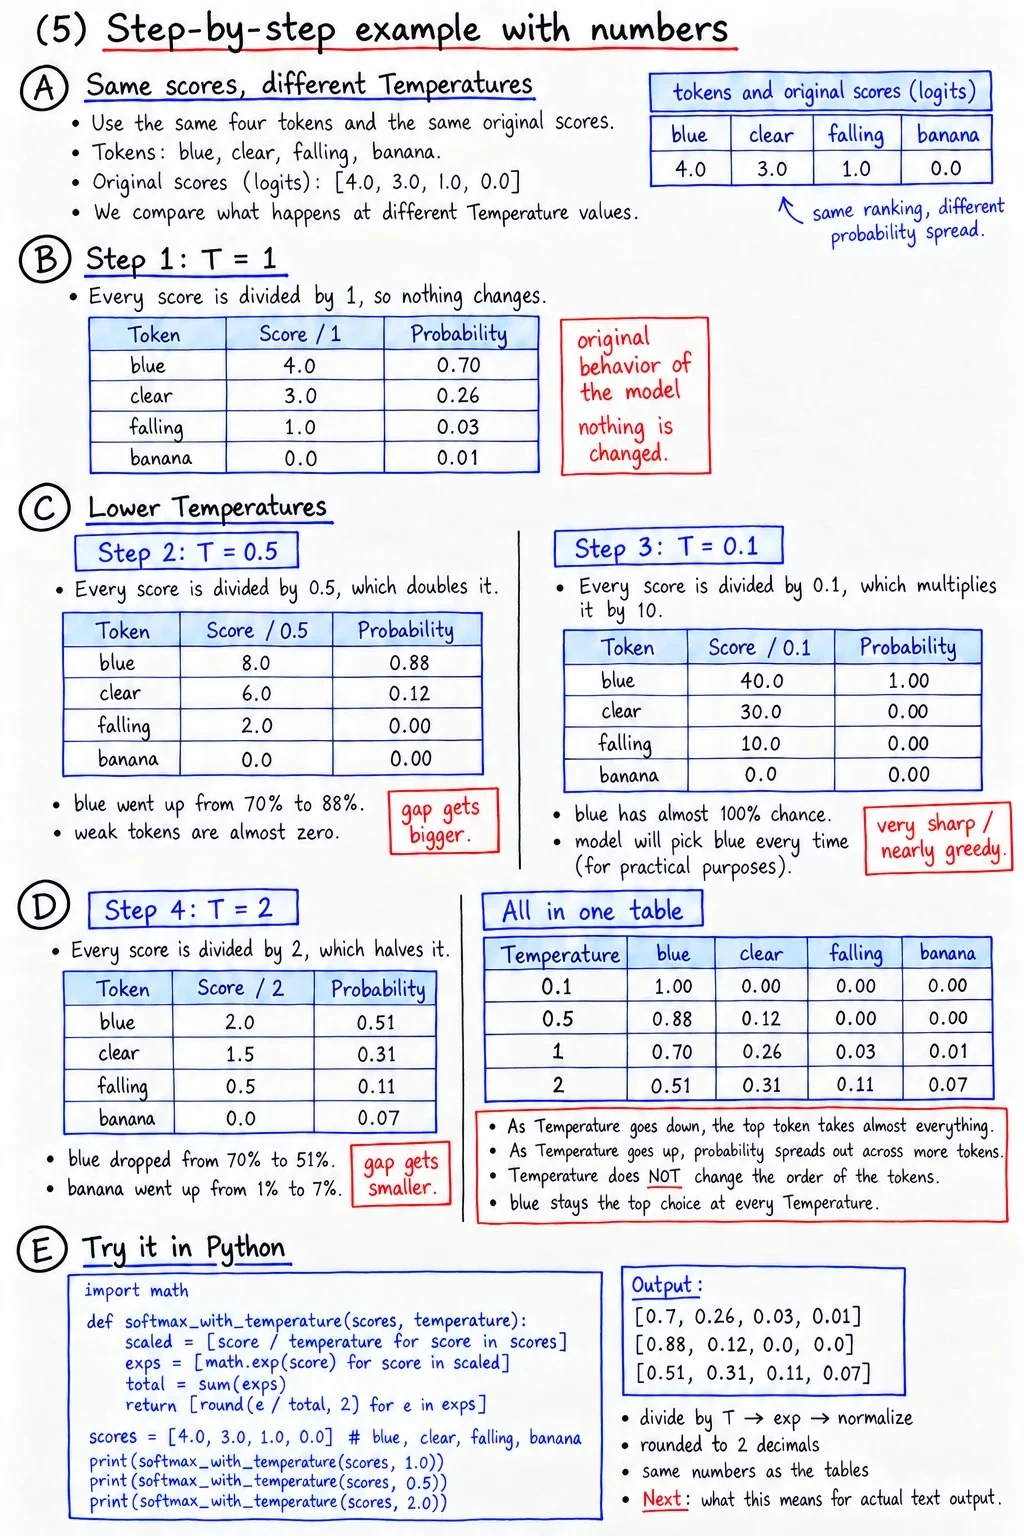
Step By Step Examples
- 06 / 9
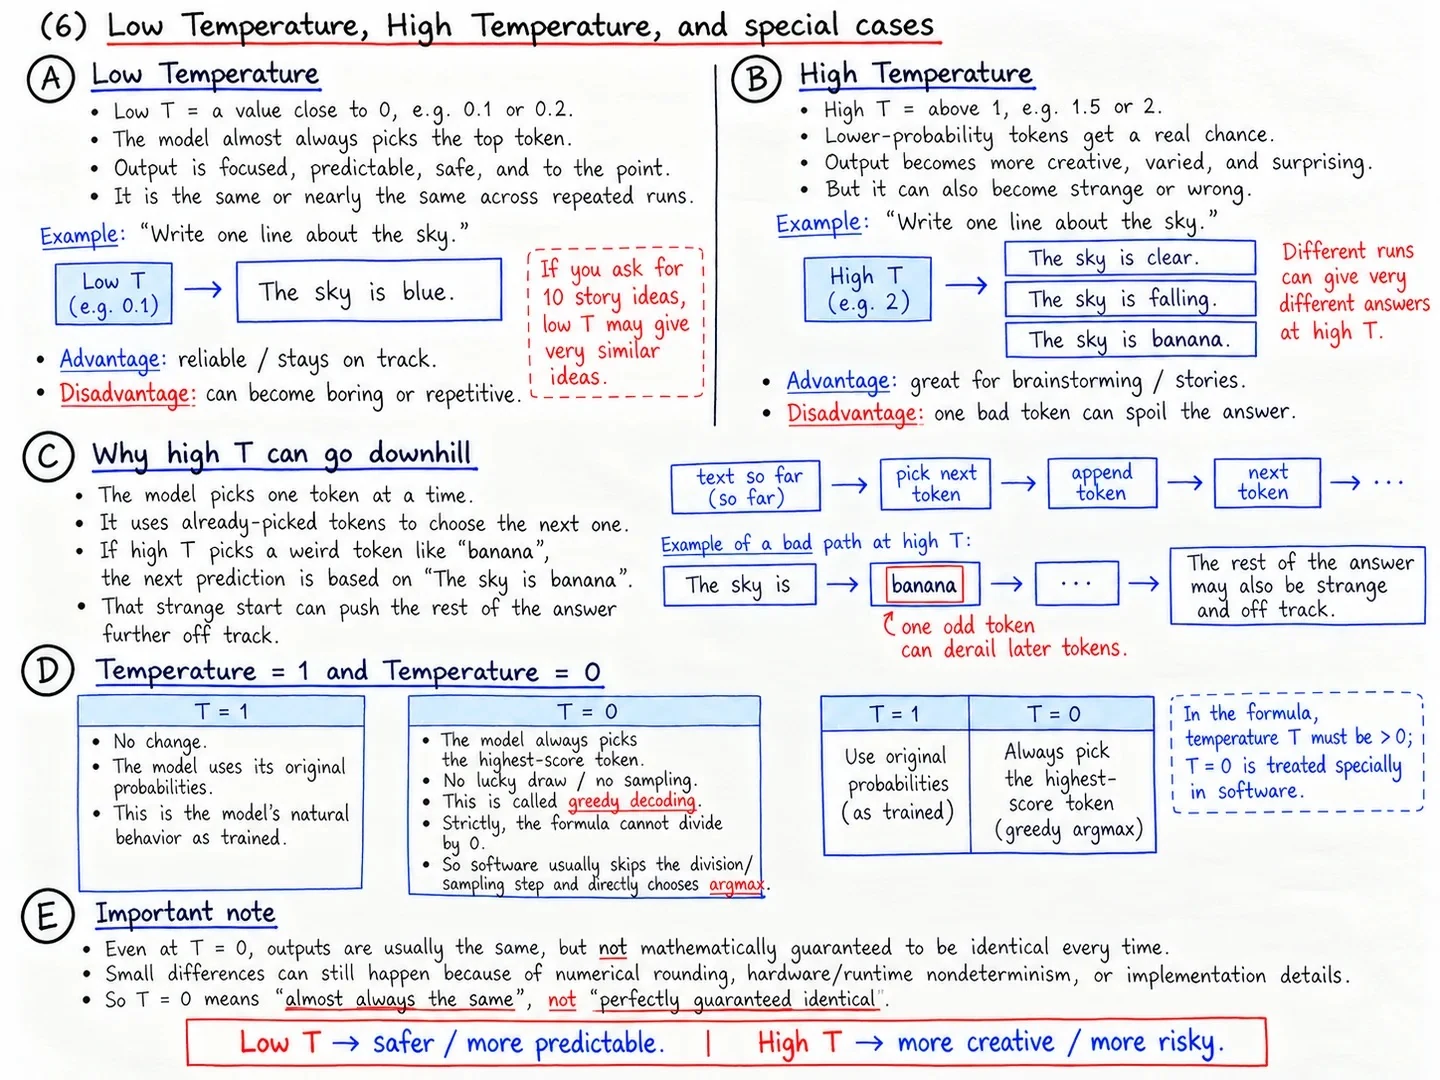
Low Temperature High Temperature and Special Cases
- 07 / 9
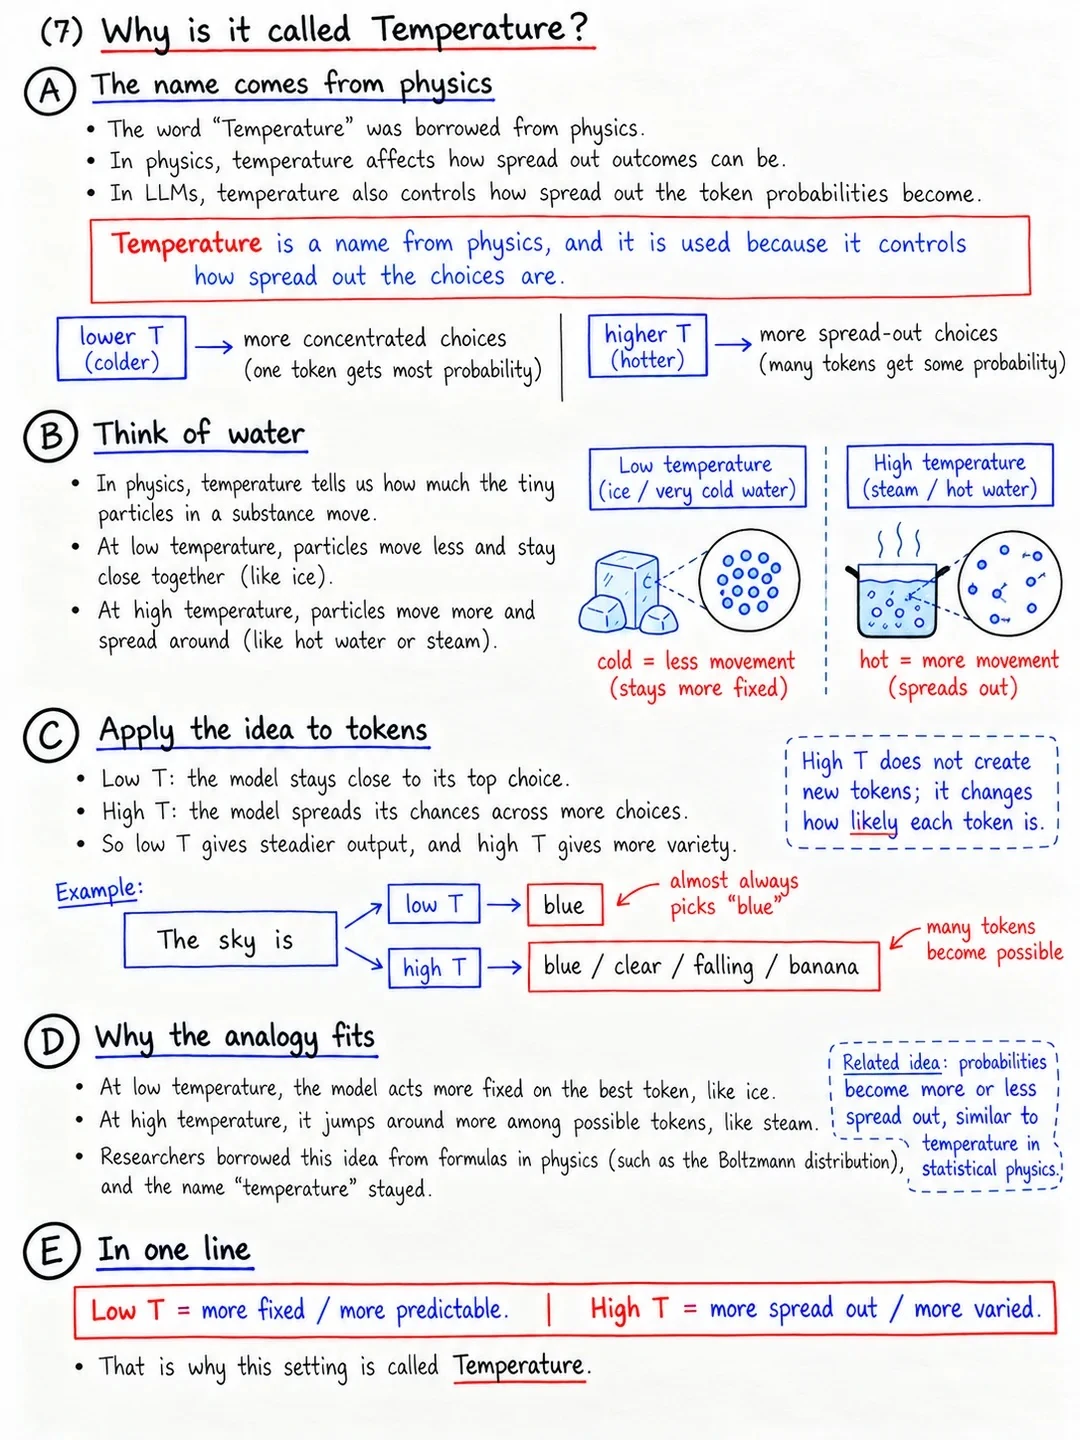
Why It Is Called Temperature
- 08 / 9
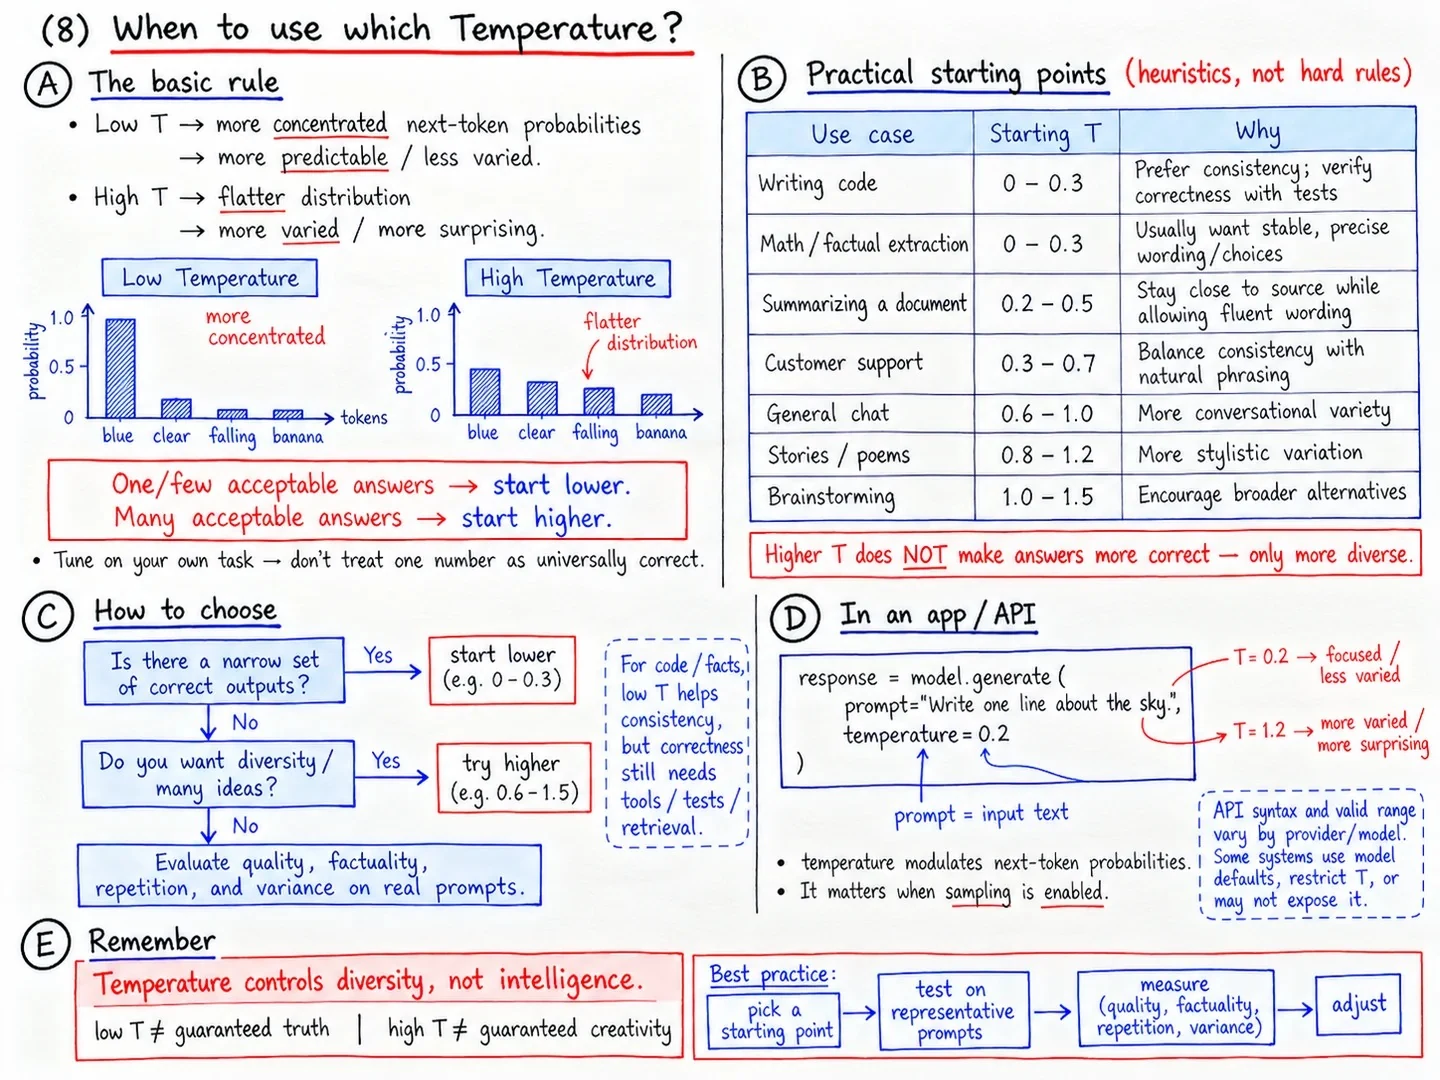
When to Use Which Temperature
- 09 / 9
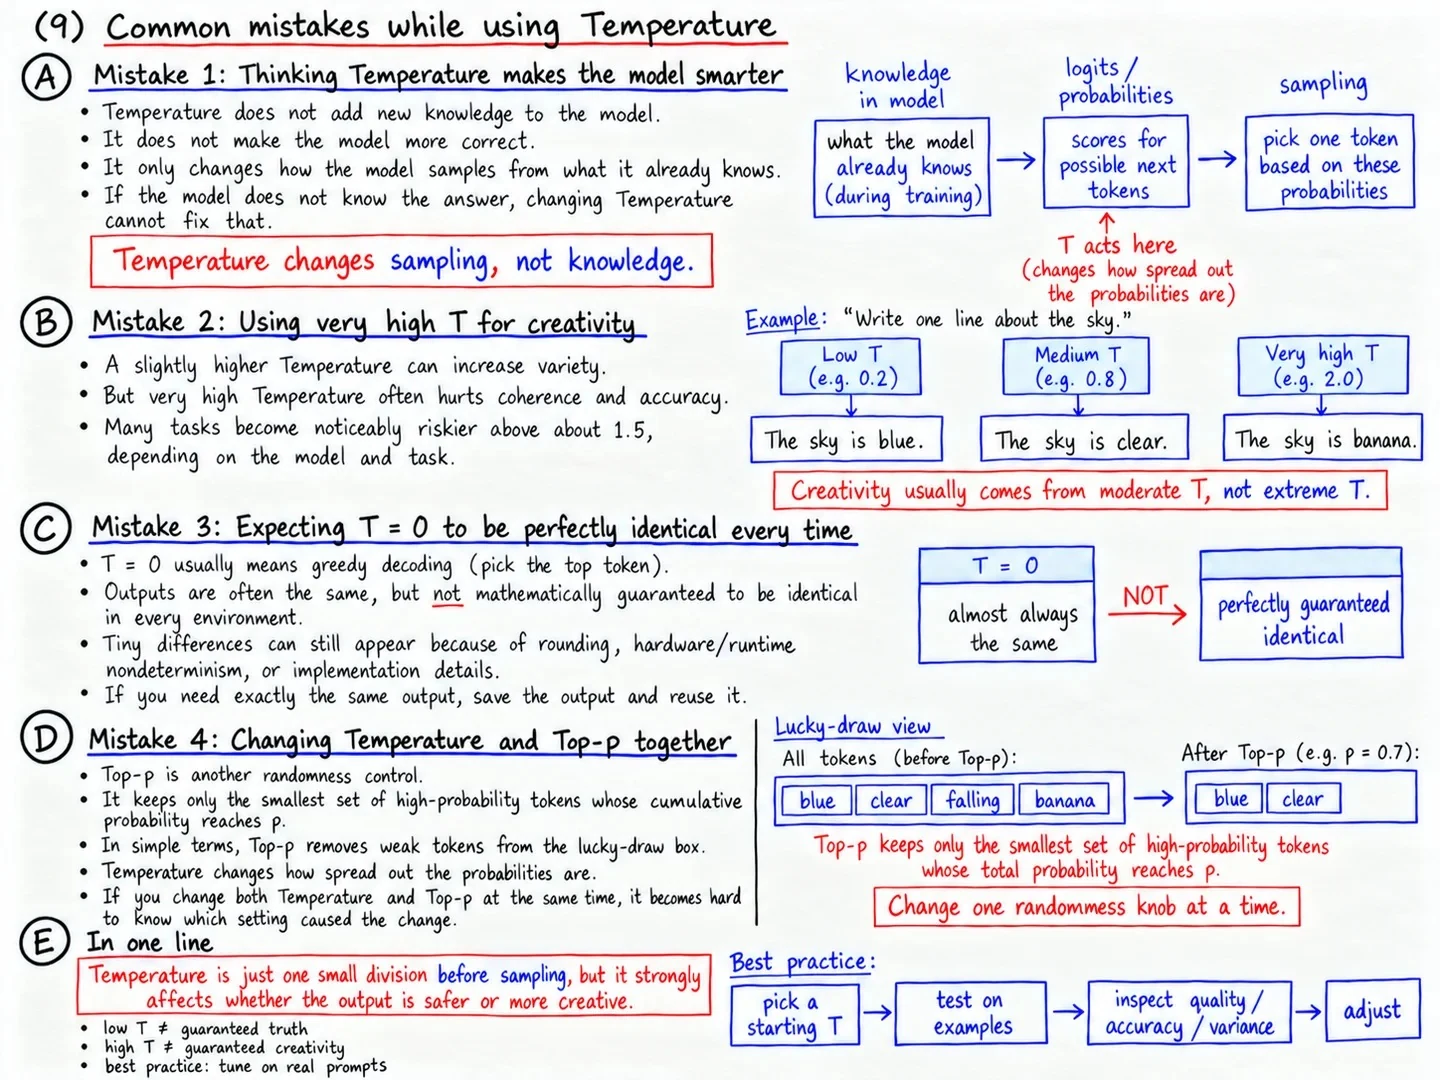
Common Mistakes When Using Temperature
← Back to all short courses
Collected from public sources for learning and reference, not my own work. If something here is yours and you would like it credited differently or taken down, please get in touch.